Image Processing and Scientific Visualization are two separate processes within the scientific research lifecycle, yet the two concepts often play off of one another. Image processing refers to the enhancement and transformation of images to prepare them for quantitative analysis. Scientific visualization is the graphical communication of data so that trends and anomalies can be more easily recognized. UVa Research Computing offers many services and resources to help researchers augment their work with image processing and scientific visualization techniques.
Image Processing
Overview
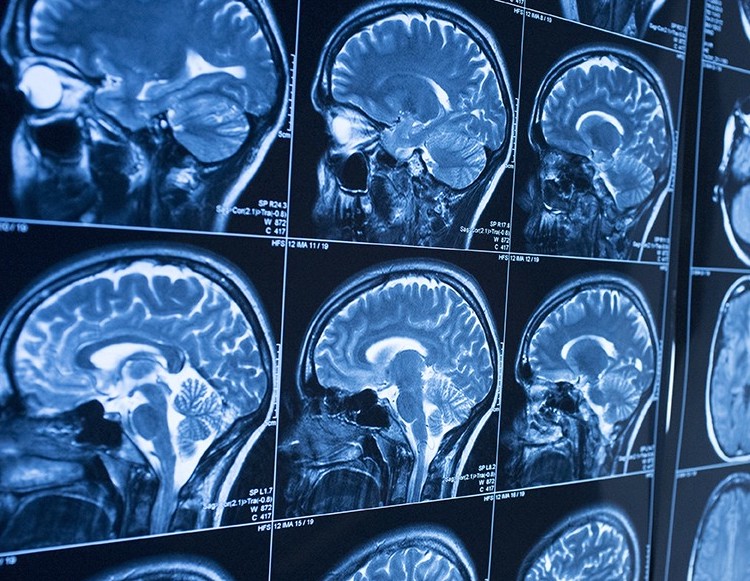
Image processing encompasses a variety of techniques to prepare images for analysis. Researchers often need to remove noise artifacts from their imaging data, or they need to analyze particular regions of interest. While manual image manipulation can easily yield the desired results, this can be time-consuming or even impossible with the amount of data we are able to collect with high throughput screening. By automating image processing steps such as noise filtering and segmentation, researchers are able to perform their work faster and for larger quantities of data.
Common Image Processing Techniques
The following techniques are commonly employed in imaging research. All of these processes can be automated and run locally on your computer or on UVa’s high performance computing (HPC) cluster. With the parallelization capabilities of HPC, it is possible to fully process and analyze a large imaging data set in a few hours or less!
| Preprocessing |
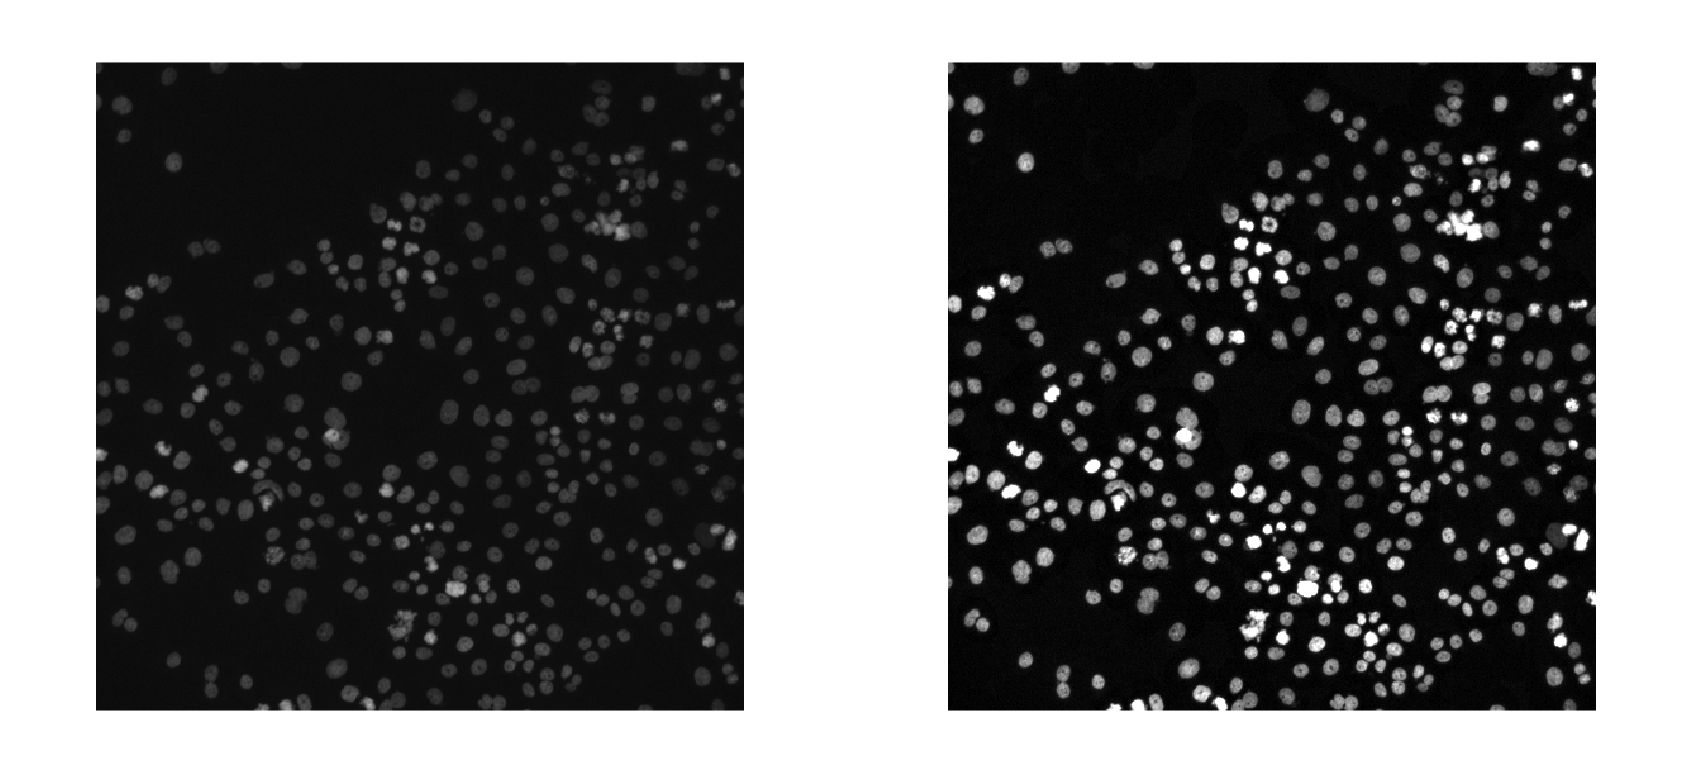 Image preprocessing can help enhance the quality of your images. Common preprocessing techniques include adjusting brightness and contrast, removing noise, sharpening images, and performing geometric and color transformations.
|
| Segmentation |
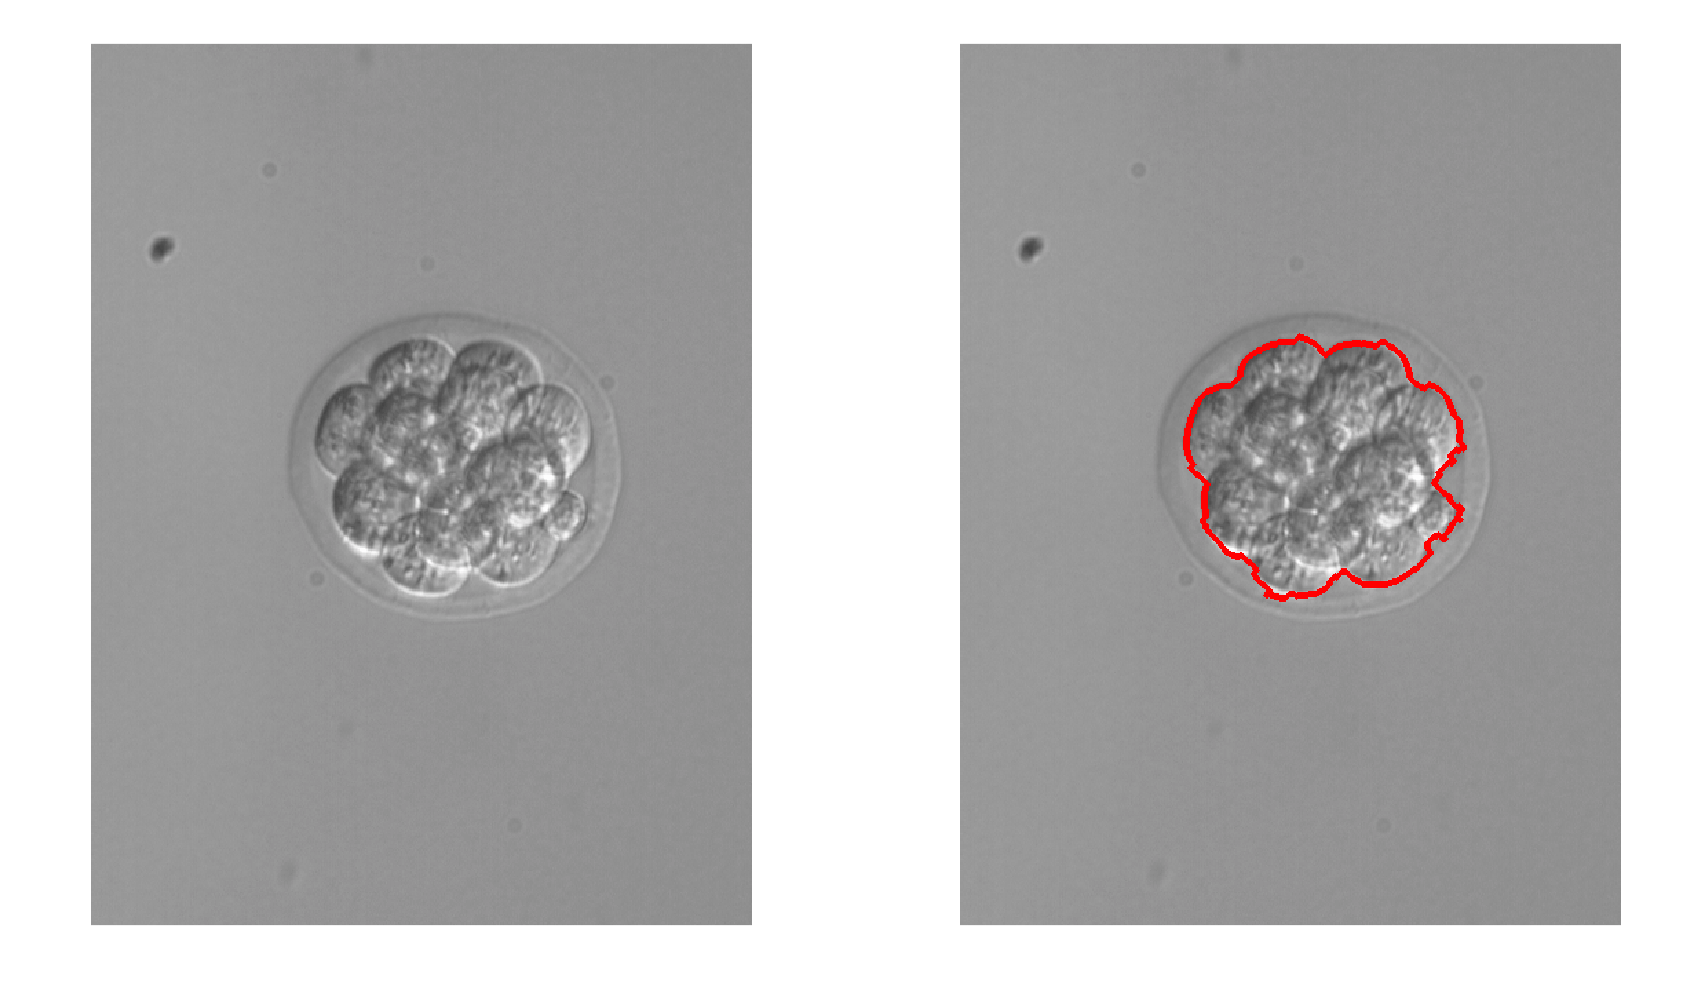 Image segmentation is useful for determining one or multiple regions of interest. Segmentation can be used to identify foreground objects, cell boundaries, or tissue types.
|
| Registration |
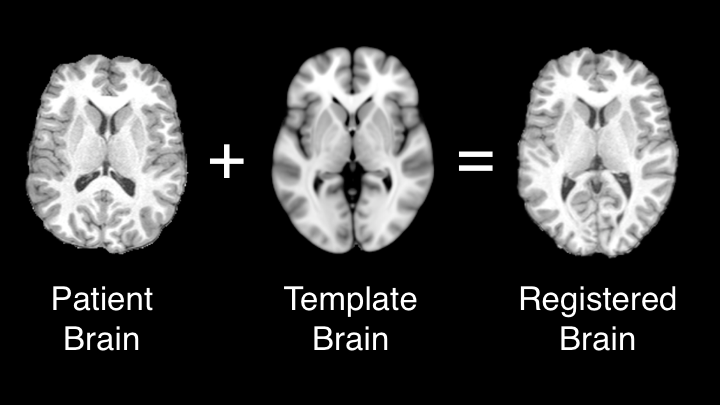 Image registration is useful when comparing two or more objects of differing size or morphological features. Registration can be used to align 2D or 3D images through linear or non-linear algorithms.
|
| Analysis |
Image analysis is the measurement and statistical analysis of meaningful features in your imaging data, such as area or volume of a region of interest and mean intensity value throughout an image.
|
Popular Software
-
ImageJ/Fiji - ImageJ is a Java-based image processing program developed at the NIH. ImageJ can be used interactively through a graphical user interface or automatically with Java. Fiji is ImageJ with common plugins pre-installed for scientific image analysis.
-
MATLAB - Matlab is a numerical computing environment with its own proprietary programming language. Matlab provides an extensive Image Processing Toolbox for with built-in functions for image registration, segmentation, and analysis.
-
Python - Python is a powerful high-level programming language for general purpose programming. There are several open source packages available in Python for image processing, including: OpenCV, scikit-image, and Python Imaging Library.
-
ANTs - ANTs, or Advanced Normalization Tools, is a state-of-the-art medical image registration and segmentation toolkit. ANTs works in conjunction with Insight Toolkit(ITK) to read and visualize multidimensional imaging data.
-
R - R is an open source programming language and computing environment for statistical analysis and data visualization. There are a variety of R packages available for image processing, such as ANTsR, EBImage, and magick.
Additional Resources
We currently offer an online short course for image processing with Fiji/ImageJ.
Stay tuned for additional online tutorials as well as in-person workshops listed on our workshops page
Visualization
Overview
Visualization is the conversion of data into plots or images in order to view various features of the data. As humans, we are able to absorb large amounts of information through sight. We can use visualizations as an exploratory tool to gain insight into the data we collect and to create hypotheses for relationships. We can also use visualizations to communicate ideas to others.
Popular Software
-
MATLAB - MATLAB contains many built-in functions for data visualization, including those for 3D surfaces and meshes. MATLAB is also capable of medical image visualization and is compatible with DICOM and NIFTI filetypes.
-
ParaView - ParaView is an open-source application for visualization and analysis of data defined on meshes or grids. It allows for visualization of 2D or 3D data and is good for general purpose, rapid visualization.
-
VisIt - VisIt is software for the visualization of data defined on meshes or grids. It is compatible with file types that have an underlying HDF5 format.
-
Blender - Blender is a 3D graphics software that can be used for creating 3D objects and animations. It can be used for 3D modeling, rendering, motion tracking, and video editing.
-
Unity - Unity is a cross-platform software application for the creation of visualizations in augmented and virtual reality.
Additional Resources
We currently offer several online tutorials for data visualization.
Stay tuned for additional online tutorials as well as our workshops posted on our workshops page
|
services
image-processing, imaging, radiology, vizlab